
If you’ve ever spent any time online researching “which car is the safest,” you likely found yourself comparing stars, awards, and rankings that seem to point in different directions.
Part of the challenge is that car safety can mean several things. A vehicle might perform well in crash tests, have features that help prevent a collision, or have a low driver death rate in real-world crashes. Each finding provides useful information, but none tells the whole story.
There’s also another factor to consider: Do vehicles with lower driver death rates also have lower death rates for other drivers involved in crashes with them?
To tackle these questions, Nomberg Law Firm brings together the latest IIHS death-rate findings, crash-test results, safety awards, insurance injury-claim data, and research on crash-prevention features. We examine how safety ratings compare with real-world outcomes, how the findings differ across vehicle sizes and types, and what they reveal about protection for a vehicle’s own drivers and risks to others.
Our goal is to help you understand what the evidence means so you can use it to make a more informed choice for yourself and your family when you purchase your next vehicle.
What does vehicle safety mean?
Vehicle safety can refer to different things depending on what a particular study or test evaluates. To better understand what actually makes a vehicle safe, Nomberg Law Firm looked at 4 types of evidence that each addressed a different aspect of vehicle safety.
Real-world deaths
We looked at the latest data from the Insurance Institute for Highway Safety (IIHS) on vehicle death rates to see how often a vehicle’s driver and other drivers died in crashes involving it.
Crash protection
We examined crash tests and safety ratings from the National Highway Traffic Safety Administration (NHTSA) and the IIHS to understand how well vehicles protected people under the conditions tested.
Injury claims
We examined insurance reports from the Highway Loss Data Institute (HLDI) to see how frequently injury-related claims were filed on different sizes and types of vehicles and how much was paid on those claims.
Crash prevention
We reviewed real-world studies of specific safety features from the Partnership for Analytics Research in Traffic Safety (PARTS) and the HLDI to identify which features were associated with fewer crashes or injury claims.
Together, these sources provide a fuller picture of vehicle safety than any single score, award, or ranking.
What can real-world driver death rates tell us about vehicle safety?
Let’s start by looking at real-world death rates from a study by the Insurance Institute for Highway Safety (IIHS), published in July 2026. These findings help us compare how frequently drivers die in crashes involving different vehicles, including vehicles of different sizes and types.
IIHS reports 2 measures:
- The driver death rate tracks deaths among drivers of the vehicle being studied.
- The other-driver death rate tracks deaths among drivers in other vehicles involved in crashes with it.
The study uses fatal crashes from 2021–2024 to estimate rates for 2023 models. It also includes similar earlier models, sometimes dating to 2020, when their designs and safety features had not substantially changed.
IIHS accounts for how many vehicles of each model are registered and for how long. This helps avoid misleading comparisons, since a model with more vehicles on the road could have more accidents and more total driver deaths simply because it’s more common.
The study also adjusts for driver age and sex, but it does not directly account for speeding, alcohol impairment, or miles driven. Differences in death rates may therefore reflect how vehicles are driven, as well as the protection they provide.
Why doesn’t the study look at newer cars?
Researchers need several years of registration and crash data to calculate meaningful death rates.
Rankings for newer models may use crash-test results and safety features, but those do not tell us the model’s real-world driver death rate.
These IIHS findings can still offer useful context when shopping for a newer model, especially if its design has remained substantially unchanged. But a redesign or changes in safety equipment can limit how well the results apply.
What the data tell us
- Driver death rates across vehicles, sizes, and types
- Death rates for drivers in other vehicles involved in crashes with them
What the data don’t tell us
- How much driving habits or miles driven explain the differences
- Who caused the crashes
- Outcomes for passengers, pedestrians, and cyclists
Which vehicles have the highest and lowest driver death rates?
The Kia Rio had the highest published driver death-rate estimate, at 170, followed by the Nissan Versa at 164. The overall rate across all vehicle sizes and types was 37.
The figures below are deaths per million registered vehicle years. Think of that as 1 million vehicles registered for 1 year each, or an equivalent amount of registration time. These are rates, rather than total death counts.
IIHS provides an uncertainty range around each death rate, so differences between published numbers do not necessarily establish that one vehicle provides better protection than another.
Vehicles with highest driver death-rate estimates
| Vehicle | Model years included | Driver death rate |
|---|---|---|
| Kia Rio | 2020–2023 | 170 |
| Nissan Versa | 2020–2023 | 164 |
| Chrysler 300, two-wheel drive | 2020–2023 | 132 |
| Dodge Charger HEMI, two-wheel drive | 2020–2023 | 127 |
| Dodge Challenger, two-wheel drive | 2020–2023 | 125 |
| Kia Forte | 2020–2023 | 120 |
Vehicles with driver death-rate estimates of zero
| Vehicle | Model years included | Driver death rate |
|---|---|---|
| Audi Q7, four-wheel drive | 2020–2023 | 0 |
| BMW X7, four-wheel drive | 2020–2023 | 0 |
| Chevrolet Tahoe, four-wheel drive | 2022–2023 | 0 |
| Mercedes-Benz GLB-Class, four-wheel drive | 2020–2023 | 0 |
| Mercedes-Benz GLE-Class, two-wheel drive | 2020–2023 | 0 |
| Toyota Tundra CrewMax, four-wheel drive | 2022–2023 | 0 |
At the other end, 6 vehicles had published rates of zero.
SUVs accounted for 18 of the 20 vehicles with the lowest published driver death rates. Small cars, sports cars, and muscle cars made up more than half of the 20 highest.
IIHS notes that driving behavior likely contributes to the higher rates for sports cars and muscle cars.
Do vehicles with lower driver death rates also have lower death rates for other drivers?
Not necessarily. Some vehicles have low rates on both measures, while others have a lower death rate for their own drivers but a higher rate for the other drivers involved in crashes with them.
To see how each vehicle performed, we compared each vehicle’s rates with the study’s overall averages of:
- 37 deaths per million registered vehicle years for the vehicle’s own drivers
- 53 deaths per million registered vehicle years for drivers in other vehicles involved in crashes with it
The study lists 188 vehicles, counting some versions of the same model separately (such as two-wheel drive and four-wheel drive).
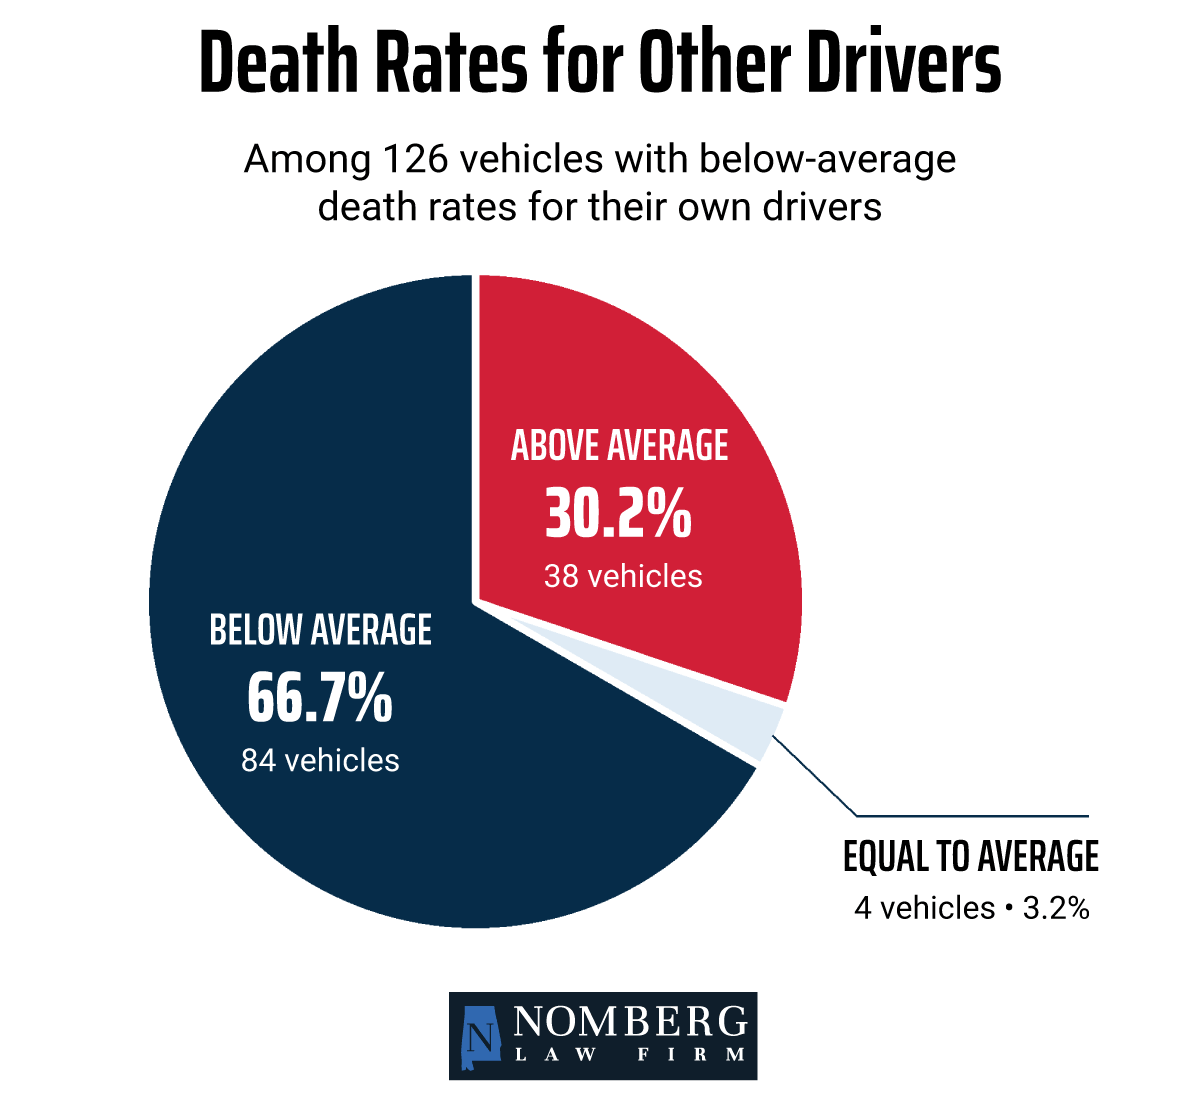
Of those vehicles, 126 (or about 67%) had driver death rates below the overall average of 37.
Among those 126, our analysis found that:
- 84 (or 67%) had other-driver death rates below 53
- 42 (or 33%) had other-driver death rates at or above 53
Of those 42 vehicles, 38 were above the other-driver average, and 4 equaled it.
That means nearly 1 in 3 vehicles with below-average death rates for their own drivers had above-average death rates for drivers in other vehicles involved in crashes with them.
Other-driver death rates among vehicles with
below-average driver death rates
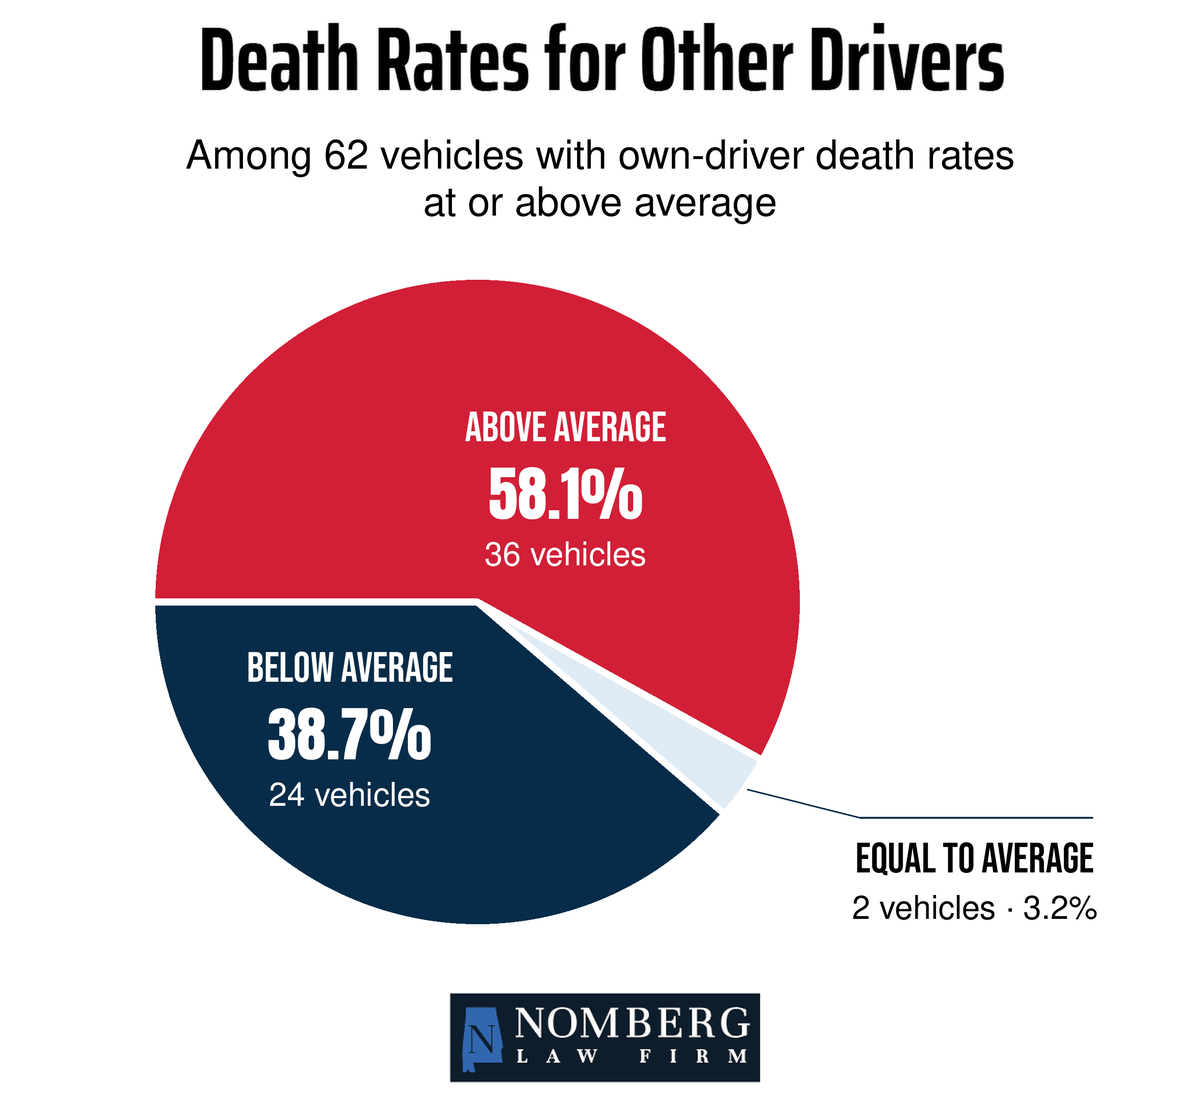
The remaining 62 vehicles (about one-third of the vehicles in the study) had driver death rates at or above the overall average.
Of those, 24 (or 39%) had below-average other-driver death rates, while 38 (or 61%) had other-driver rates at or above average.
Other-driver death rates among vehicles with
driver death rates at or above average
Our analysis found that driver and other-driver death rates fell into the same below-average or at-or-above-average categories for 65% of the vehicles. But for the remaining 35%, one rate was below average while the other was at or above it.
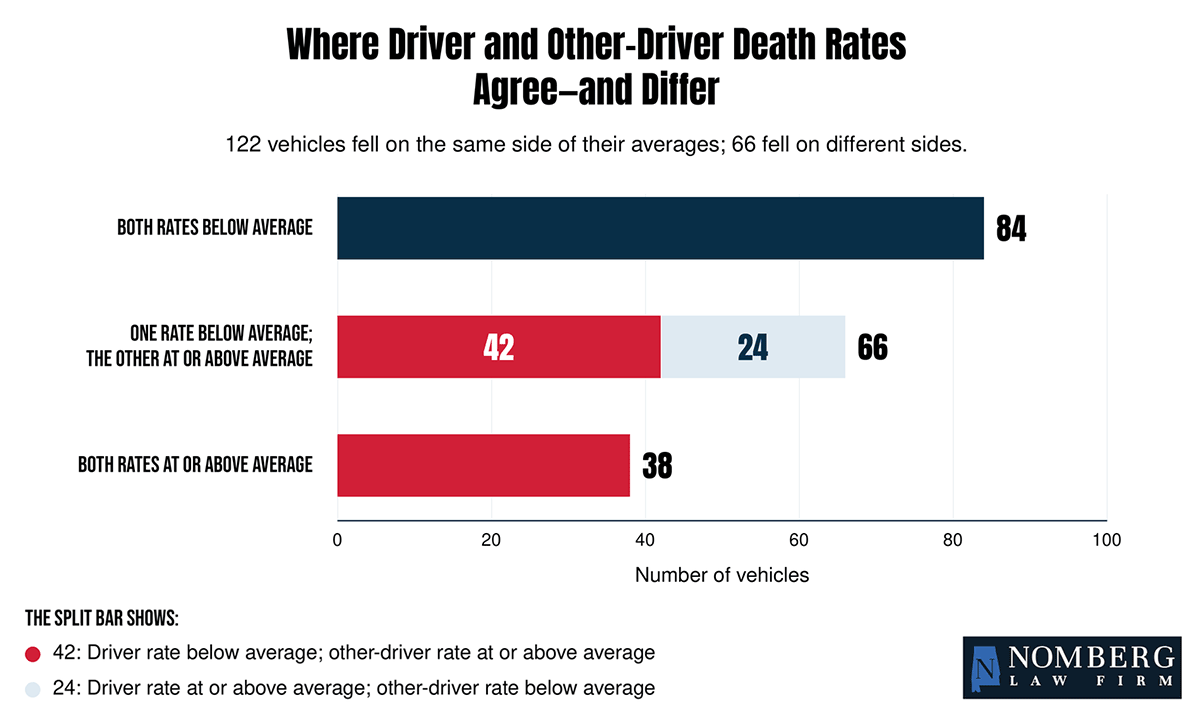
These findings show why we need to consider deaths among both a vehicle’s own drivers and other drivers involved in crashes with it. Looking only at the vehicle’s driver death rate can leave out a key part of the safety picture.
How does the pattern differ by vehicle type?
Among the pickups, SUVs, and luxury SUVs with below-average death rates for their own drivers, pickups were most likely to have other-driver death rates at or above average.
Our analysis found that this pattern occurred in:
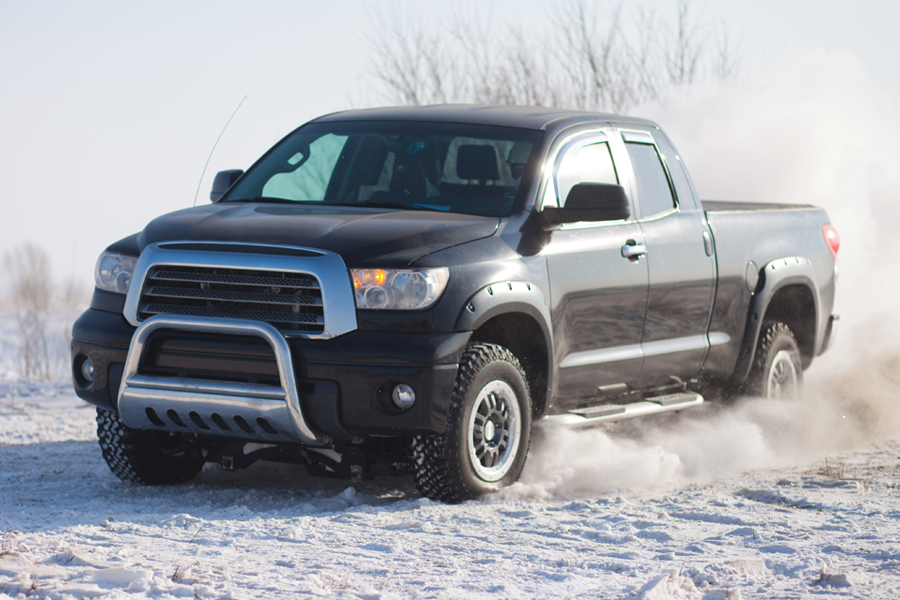
15 of 24 pickups
(62.5%)
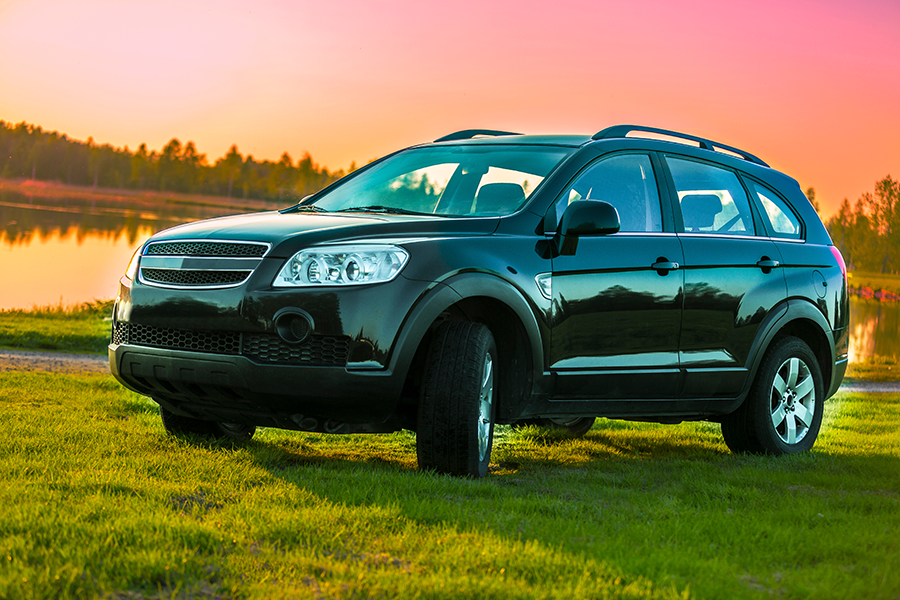
19 of 56 SUVs
(33.9%)
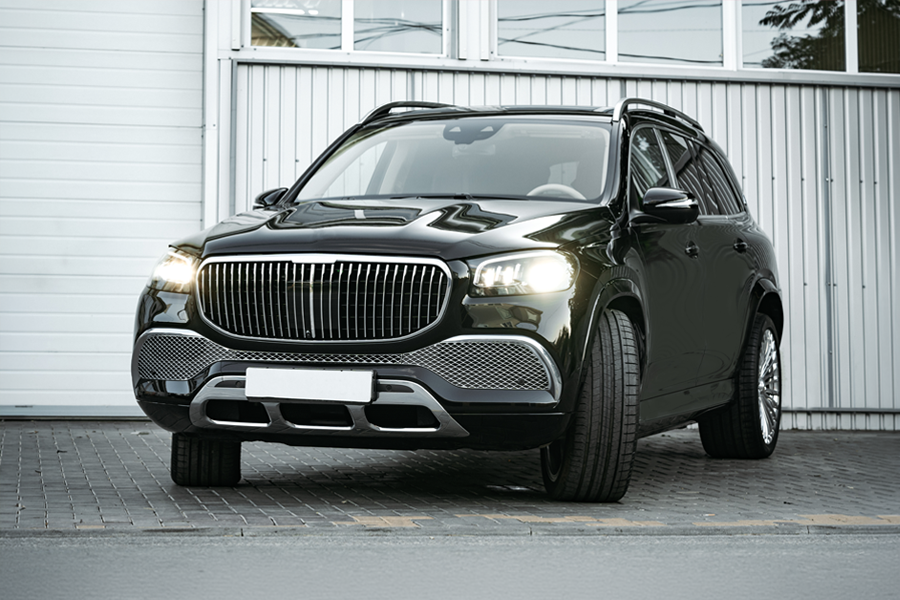
3 of 30 luxury SUVs
(10%)
That means the pattern occurred in nearly two-thirds of the pickups in this comparison, about one-third of the SUVs, and one-tenth of the luxury SUVs.
These percentages describe only the vehicles with below-average driver death rates—not all vehicles of each type or their share of traffic.
How do death rates change with vehicle size?
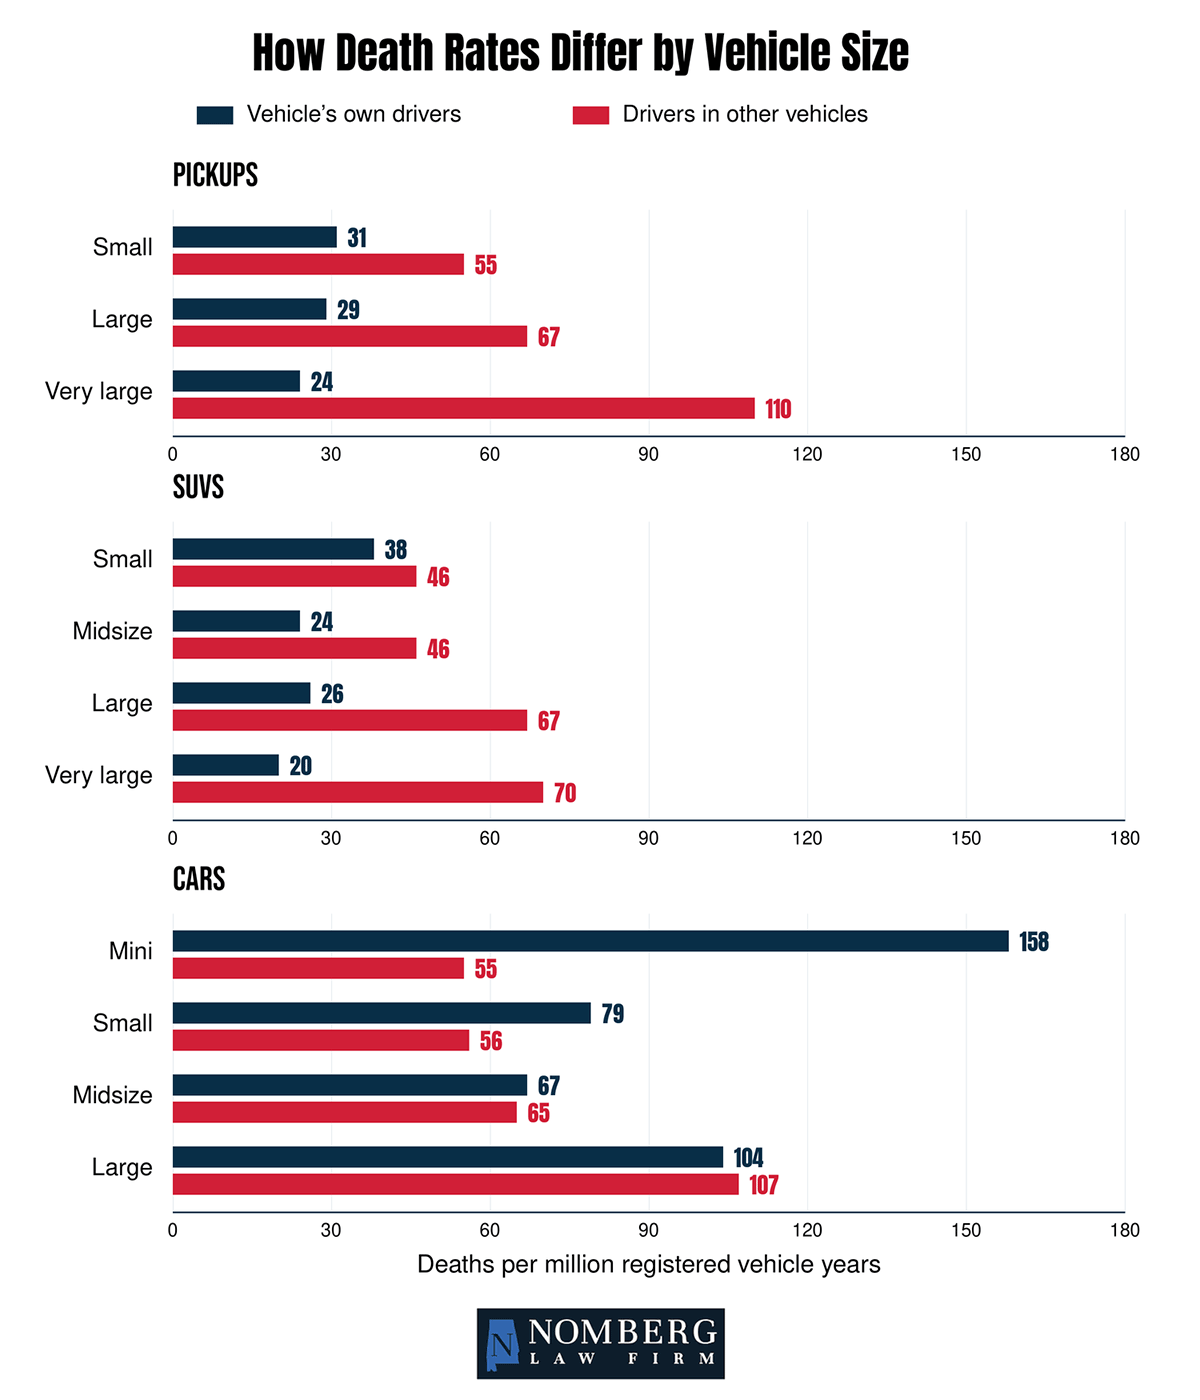
For pickups, the death rates for a vehicle’s own driver versus the other driver moved in opposite directions as vehicle size increased. Larger pickup groups had lower death rates for their own drivers but higher rates for other drivers involved in crashes with them.
| Pickup size | Driver death rate | Other-driver death rate |
|---|---|---|
| Small | 31 | 55 |
| Large | 29 | 67 |
| Very large | 24 | 110 |
SUVs showed a similar overall contrast, although driver death rates did not decrease at every size step.
| SUV size | Driver death rate | Other-driver death rate |
|---|---|---|
| Small | 38 | 46 |
| Midsize | 24 | 46 |
| Large | 26 | 67 |
| Very large | 20 | 70 |
Cars did not follow a simple “bigger is safer” pattern. Instead, driver death rates decreased from minicars through midsize cars, then increased for large cars.
| Car size | Driver death rate | Other-driver death rate |
|---|---|---|
| Mini | 158 | 55 |
| Small | 79 | 56 |
| Midsize | 67 | 65 |
| Large | 104 | 107 |
These findings reveal a tradeoff: larger pickups and SUVs generally have lower death rates for their own drivers and higher rates for other drivers.
But as the car results show, greater size does not guarantee that own-driver advantage. Size alone is therefore an incomplete measure of safety.
What do crash tests and safety ratings tell us about vehicle safety?
Death rates show what happened on real roads. Crash tests help us examine a different question. How well does a vehicle protect people inside it under specific test conditions?
The National Highway Traffic Safety Administration (NHTSA) and IIHS evaluate vehicles through separate testing and rating programs. Their methods and scoring systems differ, so a star rating and a safety award are not interchangeable.
- NHTSA rates vehicles from 1 to 5 stars using frontal and side crash tests and rollover evaluations. Five stars is the highest rating. Its overall score combines results from those evaluations.
- IIHS gives individual crash tests ratings such as Good, Acceptable, Marginal, and Poor. Its Top Safety Pick and Top Safety Pick+ awards combine requirements involving crash protection, headlights, and crash-prevention performance.
The requirements change over time, so an award must be read in the context of the year it was earned.
What the data tell us
- Protection under the crash conditions tested
- Performance of evaluated headlights and crash-prevention systems in IIHS assessments
- Rollover resistance in NHTSA evaluations
What the data don’t tell us
- A vehicle’s actual driver death rate on the road
- Its other-driver death rate
- How it will perform in every possible crash
Do NHTSA and IIHS test the same things?
Some of their evaluations overlap, but their tests and scoring methods differ. Both assess protection in frontal and side crashes. NHTSA also evaluates rollover resistance, while IIHS separately evaluates headlights and crash-prevention systems as well as whiplash prevention.
Their results can complement one another, but an NHTSA star rating cannot be directly translated into an IIHS rating or award.
Does the same safety rating mean the same protection across all types of vehicles?
Not necessarily. A 5-star SUV and a 5-star small car do not necessarily provide equal protection. NHTSA’s frontal and overall star ratings are intended for comparing vehicles in the same class and within 250 pounds of one another.
For IIHS awards, you have to check which versions qualify. An award may apply only to a version with a particular headlight or optional crash-prevention feature.
How do safety ratings compare with the real-world death rates?
To explore this question, we started with the vehicles in the latest IIHS death-rate study. We then checked their NHTSA ratings and IIHS crash-test results, making sure those results applied to the vehicle versions and model years being studied.
Next, we compared death rates among vehicles with higher and lower ratings—4 and 5 stars from NHTSA, and Good and Poor ratings in the IIHS updated side test. We also examined midsize cars with top ratings from both testing programs to see how their real-world driver death rates differed.
Our findings showed some agreement between ratings and death rates, but higher ratings did not consistently mean lower death rates.
What did the NHTSA safety rating comparison show?
We identified 98 vehicles with clear matches to standard NHTSA rating records across the model years studied. Of those, 81 consistently received 5 stars overall, and 17 consistently received 4 stars (the lowest overall rating in our matched group).
Among the 5-star vehicles:
- 28 (35%) had driver death rates at or above the overall IIHS average of 37
- 27 (33%) had other-driver death rates at or above their separate average of 53
Among the 4-star vehicles:
- 6 (35%) had driver death rates at or above average
- 8 (47%) had other-driver death rates at or above average
Real-world death rates among vehicles with 4-star and 5-star NHTSA ratings
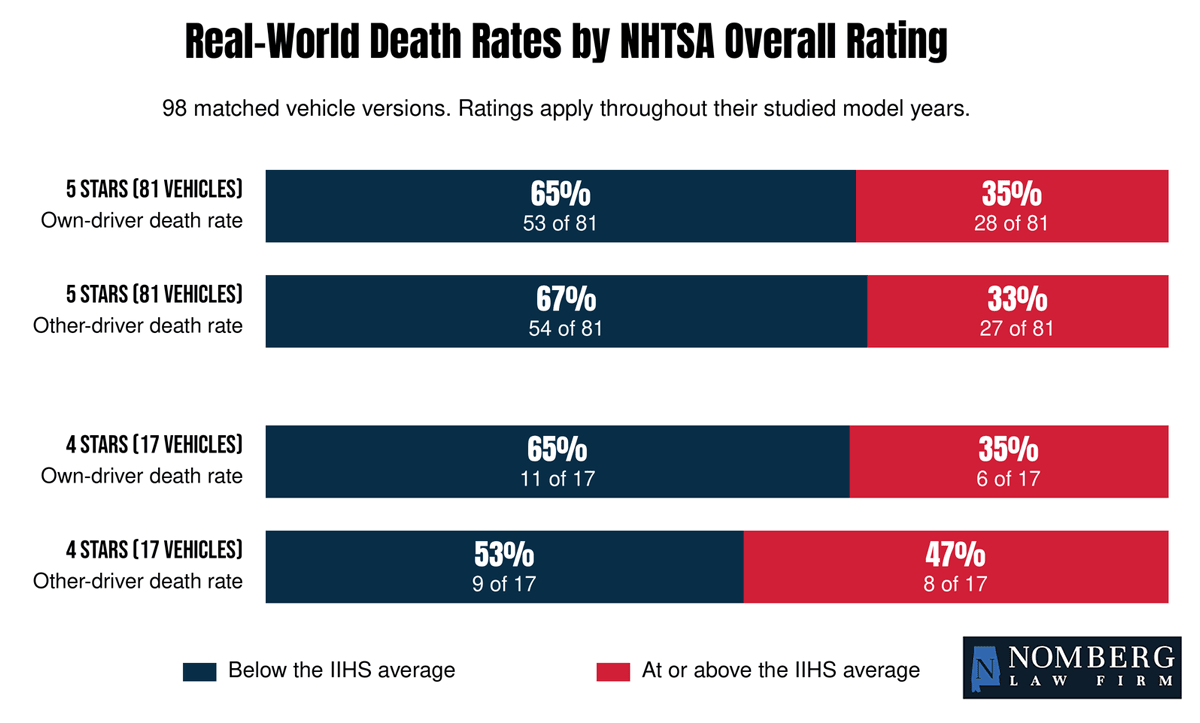
Most vehicles in both groups had below-average driver death rates. However, about 35% of both 4-star and 5-star vehicles had driver death rates at or above average.
The 4-star group also had a higher percentage with other-driver death rates at or above average (47% compared to 33% in the 5-star group).
These findings show that vehicles that earned 5 stars did not consistently have below-average real-world death rates. The percentages describe the vehicles we compared; they do not establish that 4-star and 5-star vehicles provide equal protection for drivers.
What did the IIHS side-test comparison show?
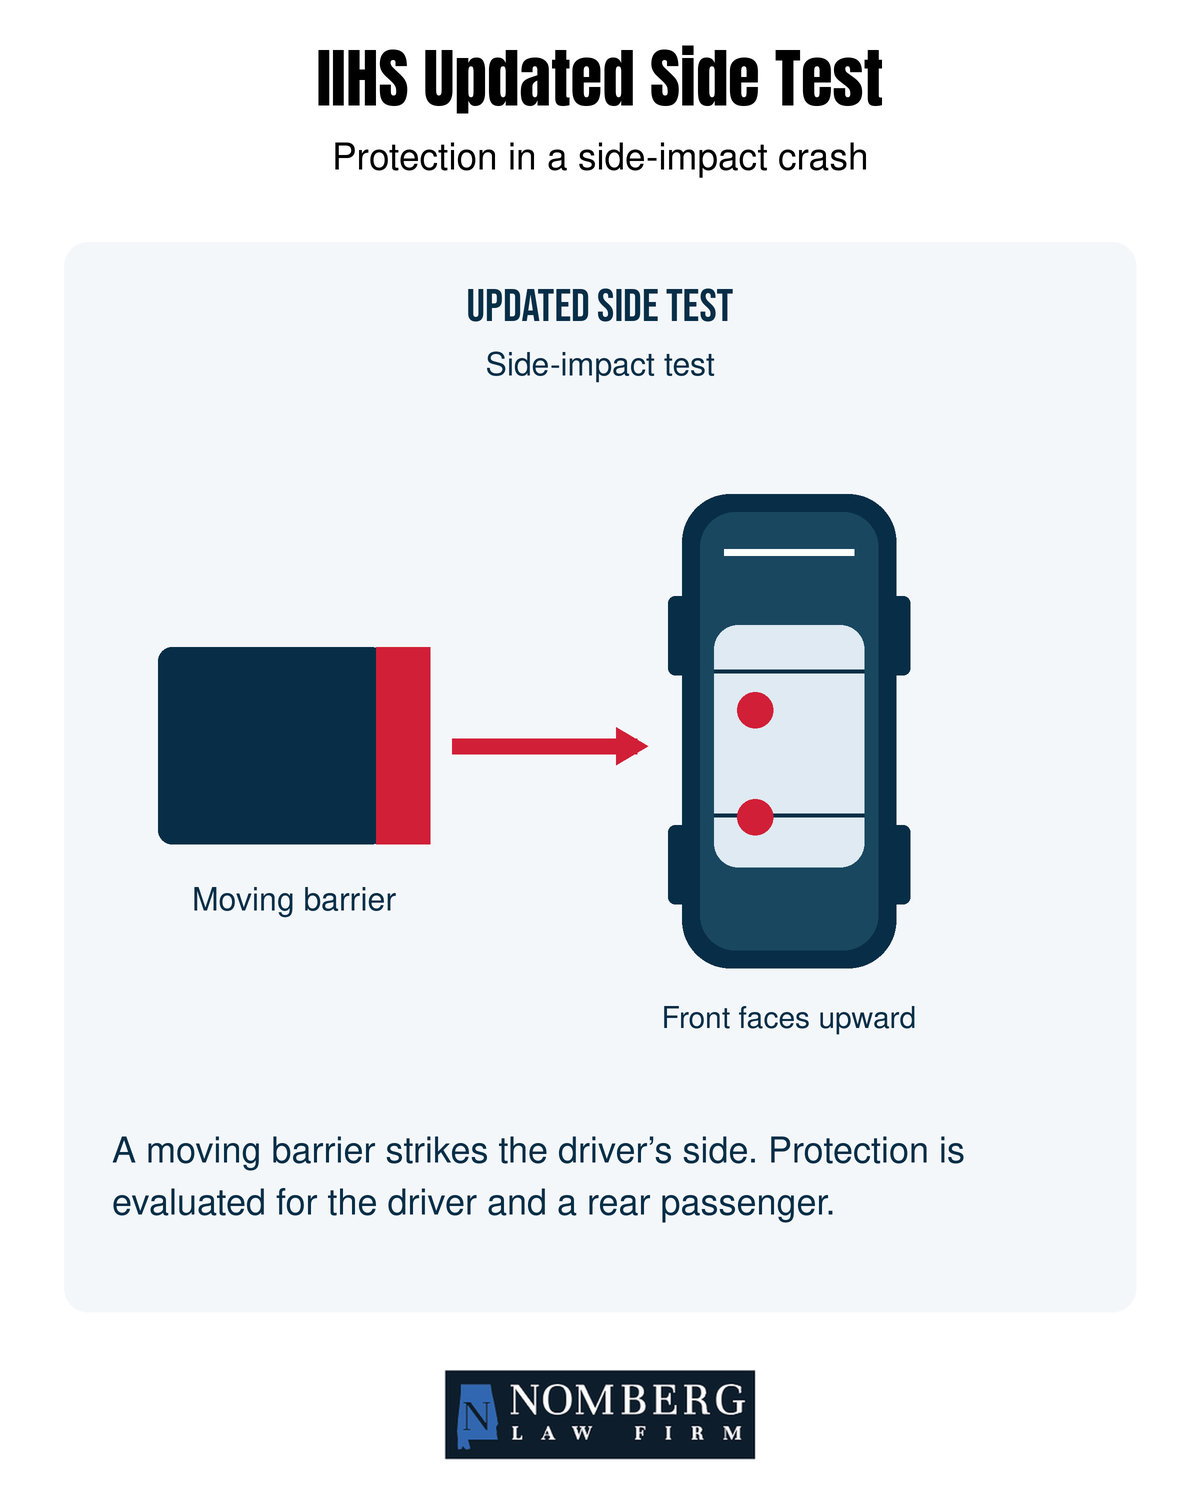
To compare IIHS crash-test ratings with real-world driver deaths, we used IIHS’s updated side test because it offered a broader group of vehicles with different ratings, allowing us to compare stronger and weaker test performance with real-world death rates.
We matched 58 vehicles to results that apply across their included model years. Of those vehicles, 22 earned Good—the highest rating—and 7 earned Poor—the lowest. The remaining 29 earned Acceptable or Marginal ratings.
Among the Good-rated vehicles:
- 1 (5%) had a driver death rate at or above average
- 4 (18%) had other-driver death rates at or above average
Among the Poor-rated vehicles:
- 4 (57%) had driver death rates at or above average
- 3 (43%) had other-driver death rates at or above average
Real-world death rates among vehicles rated Good and Poor in the IIHS updated side test
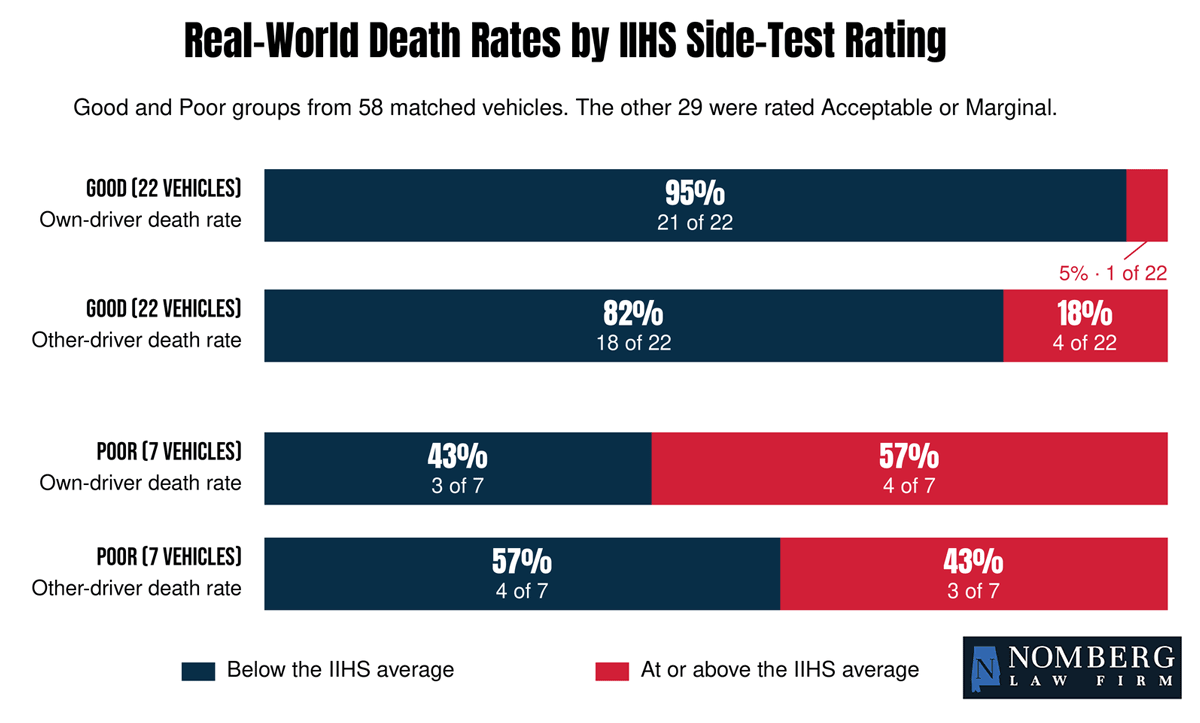
In this comparison, 95% of Good-rated vehicles had below-average driver death rates, compared with 43% of Poor-rated vehicles. Better side-test ratings therefore lined up with lower death rates more often, but not in every case.
Most Good-rated vehicles were SUVs, and only 7 vehicles were rated Poor. Those differences mean we cannot attribute the results to test performance alone.
Together, these comparisons show that strong safety ratings can accompany lower real-world death rates, but they do not guarantee them. Looking at both can provide a fuller picture of vehicle safety.
What did we find among vehicles with top ratings from both NHTSA and IIHS?
Next, we looked for vehicles we could compare across all 3 sources—the IIHS death-rate study, NHTSA ratings, and IIHS crash-test results. We focused on midsize cars so we could compare vehicles of the same size and type.
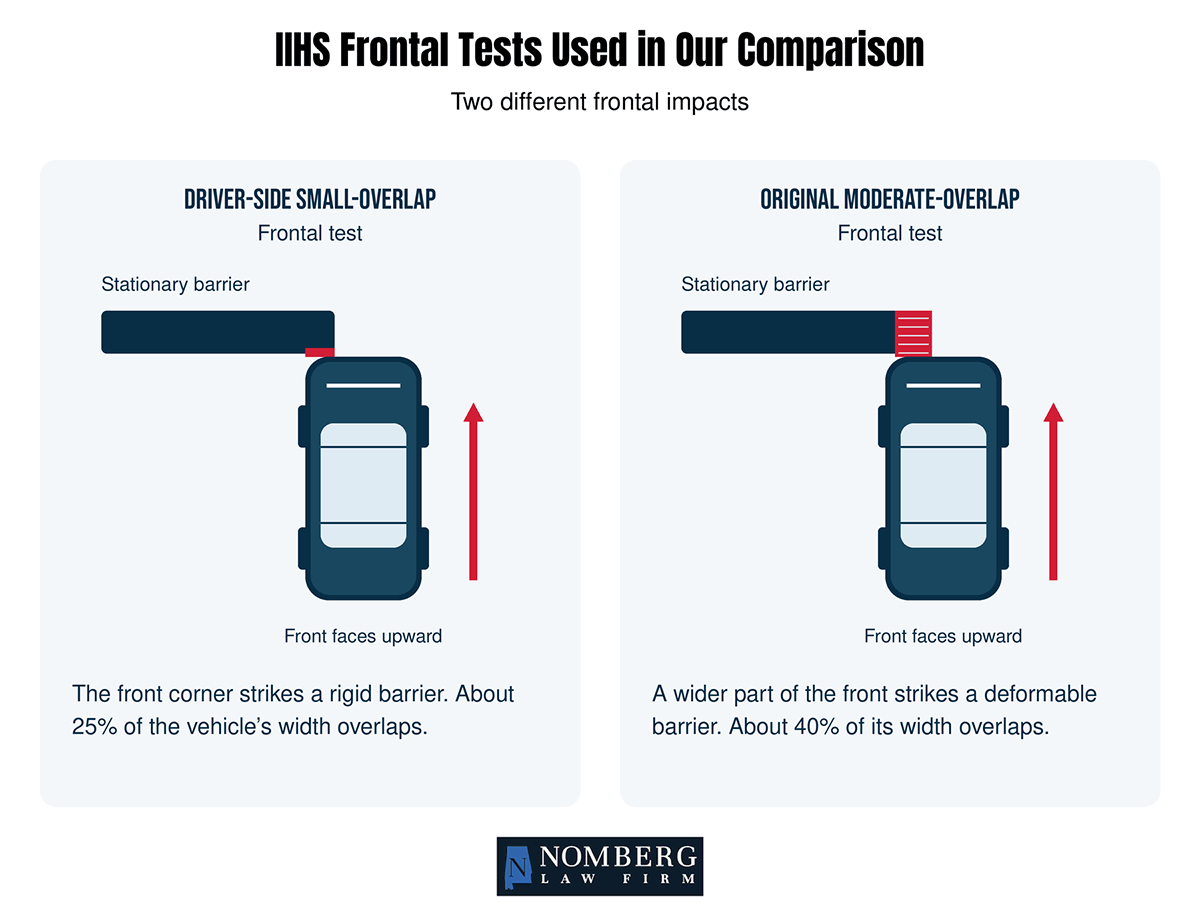
IIHS gives separate ratings for different kinds of crashes, including frontal and side impacts. We used the driver-side small-overlap test and the original moderate-overlap frontal test because their results applied to all the model years included in each car’s death-rate calculation. The 2 tests examined crashes involving a front corner of the vehicle and a larger portion of its front.
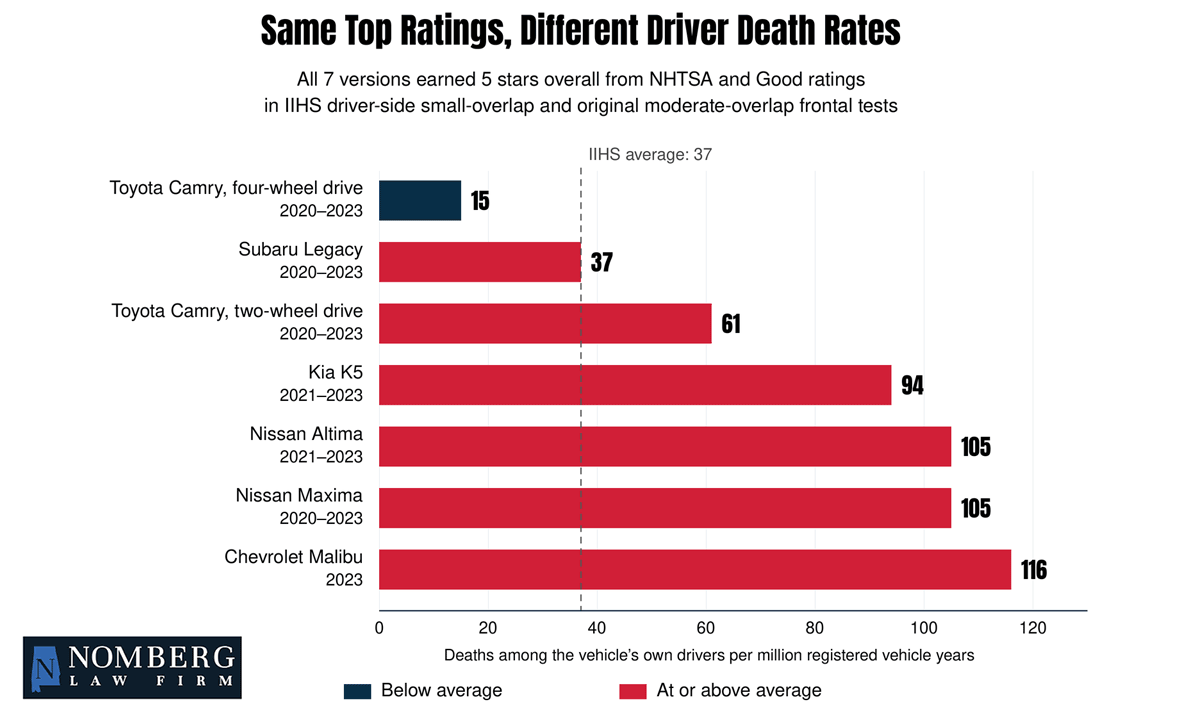
We identified 7 midsize-car versions with 5-star overall NHTSA ratings and Good ratings in both frontal tests. Their published death rates for their own drivers ranged from 15 for the four-wheel-drive Toyota Camry to 116 for the Chevrolet Malibu.
Driver death rates for top-rated midsize cars compared with all-vehicle average
If we instead compare these vehicles with the average driver death rate for regular midsize cars—67, rather than 37 for all vehicles—3 versions fall below average, and 4 are above. Both Camry versions and the Subaru Legacy fall below the midsize-car average.
Driver death rates for top-rated midsize cars compared with midsize-car average
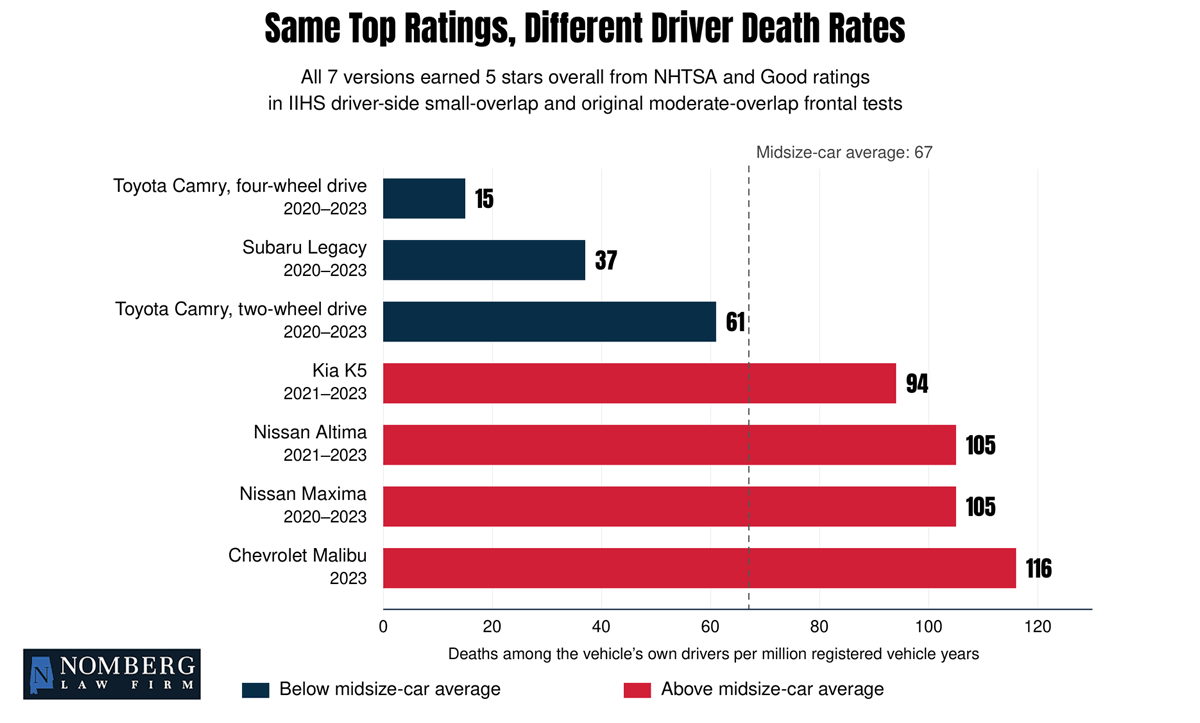
Even among cars of the same size and type, shared top ratings did not mean similar real-world driver death rates.
Changing the average changed which cars fell above or below it, but substantial differences remained.
Safety ratings are therefore a useful starting point, rather than a complete answer to which vehicle is safest.
Does better crash-test performance still matter?
Yes. A separate IIHS study found that drivers in vehicles rated Good in the driver-side small-overlap frontal test were 12% less likely to die in frontal crashes than drivers in vehicles rated Poor.
Researchers accounted for driver age and sex, vehicle type and weight, and the number of vehicles involved in the crash.
That study examined the risk of dying when involved in a frontal crash. Our comparisons looked at death rates across all crash types. The findings support the value of crash testing while showing why a test rating cannot tell us everything about real-world safety.
So, which vehicles had top scores in NHTSA and IIHS crash tests and lower driver death rates?
To identify vehicles that performed well across the sources we examined, we looked for versions that met all of these requirements:
- 5-star overall NHTSA ratings throughout the model years included in their death-rate results
- Good overall IIHS ratings in the driver-side and passenger-side small-overlap frontal tests, the original moderate-overlap frontal test, and the updated side test
- A driver death rate below the overall IIHS average of 37
Within our reviewed matches, 11 vehicle versions qualified. The table below lists them from lowest to highest published driver death rate and includes other-driver death rates for context.
Vehicles meeting our selected crash-test and driver death-rate criteria
| Vehicle | Model years included | Driver death rate | Other-driver death rate |
|---|---|---|---|
| Volkswagen Atlas, 2-wheel drive | 2020–2023 | 5 | 94 |
| Toyota Highlander, 4-wheel drive | 2020–2023 | 7 | 39 |
| Volkswagen Atlas, 4-wheel drive | 2020–2023 | 7 | 13 |
| Honda Odyssey | 2022–2023 | 11 | 31 |
| Subaru Ascent | 2020–2023 | 15 | 38 |
| Mazda CX-9, 4-wheel drive | 2020–2023 | 16 | 45 |
| Mazda CX-5, 4-wheel drive | 2020–2023 | 17 | 30 |
| Acura RDX, 4-wheel drive | 2020–2023 | 23 | 34 |
| Nissan Pathfinder, 4-wheel drive | 2022–2023 | 24 | 49 |
| Volkswagen Atlas Cross Sport, 4-wheel drive | 2020–2023 | 26 | 48 |
| Toyota Highlander, 2-wheel drive | 2020–2023 | 30 | 68 |
Death rates are deaths per million registered vehicle years. The overall averages are 37 for the vehicle’s own drivers and 53 for other drivers.
These vehicles met the criteria we selected, but that does not make them a definitive list of the safest vehicles. Additionally, their death rates have overlapping uncertainty ranges, so appearing higher on the list does not necessarily mean a vehicle is safer than those below it.
Qualifying also does not mean a vehicle earned top results in every safety assessment. In the newer IIHS moderate-overlap frontal test, which includes rear-seat protection, the Honda Odyssey earned Poor for 2023 models, and the Mazda CX-9 earned Poor for 2021–2023 models. Those results remain relevant when considering these vehicles.
The list also reinforces the distinction between safety for a vehicle’s own driver and risk to others. Although every vehicle qualified with a below-average driver death rate, the two-wheel-drive Atlas and Highlander had above-average other-driver death rates.
While these vehicles offer a good starting point, choosing among them means looking at which strengths and limitations matter most for how and where you drive.
Why didn’t Tesla make our shortlist?
For some Tesla versions, the deciding factor was a gap in matching crash-test results, rather than low safety scores.
For 2020–2023 models, the two-wheel-drive Model 3 and four-wheel-drive Model Y earned 5-star overall NHTSA ratings and Good ratings in the 3 IIHS frontal tests we selected.
Both also had below-average death rates for their own drivers and other drivers. The Model 3’s driver death rate was 15, and the Model Y’s was 18—both below the overall average of 37 and lower than the published rates for several vehicles on our shortlist.
However, neither Tesla had updated IIHS side-test results covering all the model years included in its death-rate findings. That missing coverage kept them off the list. Other Tesla versions lacked required ratings or had driver death rates above our cutoff.
Their absence reflects the evidence available for the years studied, rather than a finding that they’re less safe than the vehicles on our shortlist.
What can insurance injury claims tell us about vehicle safety?
Death rates capture the most serious crash outcomes, but insurance claims add another perspective by showing us how often crashes lead to injury-related claims.
The Highway Loss Data Institute (HLDI) publishes insurance data by vehicle model, size, and type. We used its reports for 2022–2024 models to examine 2 kinds of injury coverage:
- Personal injury protection (PIP). Covers crash injuries to insured drivers and people in their vehicles, regardless of fault.
- Bodily injury liability. Covers injuries to other people for which the insured driver is responsible.
We examined how often injury claims were filed as well as the average payment per PIP claim for SUVs. Each result is compared with the average for that coverage type.
What the data tell us
- How often injury-related insurance claims were filed
- How claim patterns differ across vehicle sizes and types
- Average payments per PIP claim across SUV sizes
What the data don’t tell us
- The number of people injured or how serious their injuries were
- Whether the individual vehicles in our death-rate comparison also had fewer injury claims
Do injury claims show the same tradeoff we saw in death rates?
For pickups, the broad pattern was similar. As pickup size increased, PIP claims became less frequent, while bodily injury liability claims became more frequent.
Very large pickups had PIP claim frequency 46% below average but bodily injury liability claim frequency 21% above average. This echoes the death-rate findings: fewer claims involving injuries inside the insured vehicle alongside more claims involving injuries to others.
SUVs showed a different pattern. Larger SUV groups generally had fewer PIP claims than small SUVs, but bodily injury liability claim frequency stayed below average across all 4 size groups shown. It did not rise steadily with size.
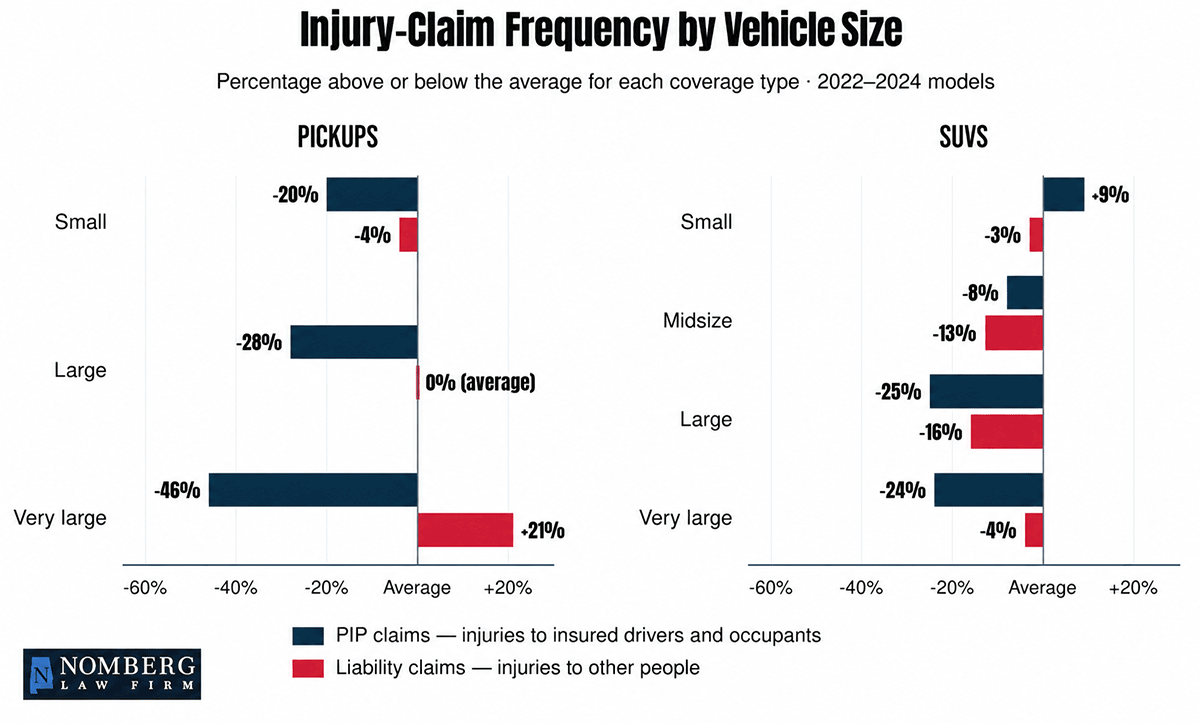
These reports cover different model years and populations from the death-rate study, so they provide supporting context rather than a direct confirmation of the fatality results.
While the pickup findings reinforce the distinction between protection for people inside a vehicle and harm to others, the SUV findings show why that pattern should not be assumed to apply equally to every vehicle type.
Do higher claim payments mean worse injuries?
They could, but the HLDI reports do not tell us whether more serious injuries explain higher payments.
Larger SUVs generally had fewer PIP claims, but insurers paid more per claim, on average. Very large SUVs, for example, had claims 24% less frequently than average, while the average payment per claim was 17% higher.
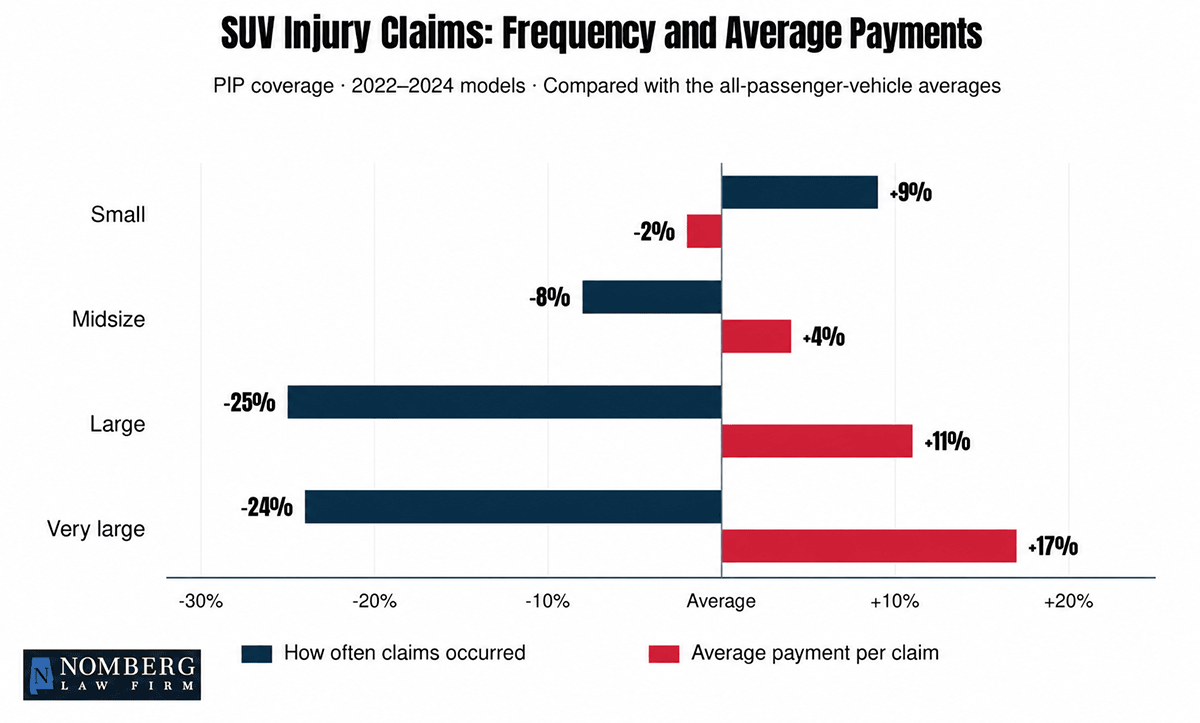
PIP claims involving people in larger SUVs were generally less frequent, but when a claim occurred, the average payment was higher. One possible explanation is that the injuries leading to those claims were more serious or required more treatment.
However, treatment costs and other covered expenses could also explain higher payments, so we cannot definitively conclude that higher-value claims involved more serious injuries.
Which safety features have been shown to actually prevent crashes?
Another key aspect of vehicle safety is being able to prevent a crash from happening in the first place. Real-world research shows that some driver-assistance features can help, although their benefits depend on the system and the situation.
To understand which safety features help drivers avoid accidents in real life, we examined newer research from the Partnership for Analytics Research in Traffic Safety (PARTS), which brings together NHTSA, automakers, and researchers at MITRE, alongside HLDI insurance studies.
We also looked at IIHS research on Waymo’s driverless vehicles.
These studies show where crash-prevention benefits have been demonstrated and what remains uncertain. Here’s what we found.
What the data tell us
- Benefits associated with individual features or feature combinations
- Reductions in the particular crash types or insurance claims studied
- How Waymo’s driverless crash rates compared with human drivers in the locations studied
What the data don’t tell us
- That every system with the same feature performs equally
- How well a system will perform in every driving situation
- Whether these features explain the death-rate differences in our vehicle comparisons
- Whether Waymo’s results apply to other driverless systems or personally owned vehicles
Automatic emergency braking reduces rear-end crashes
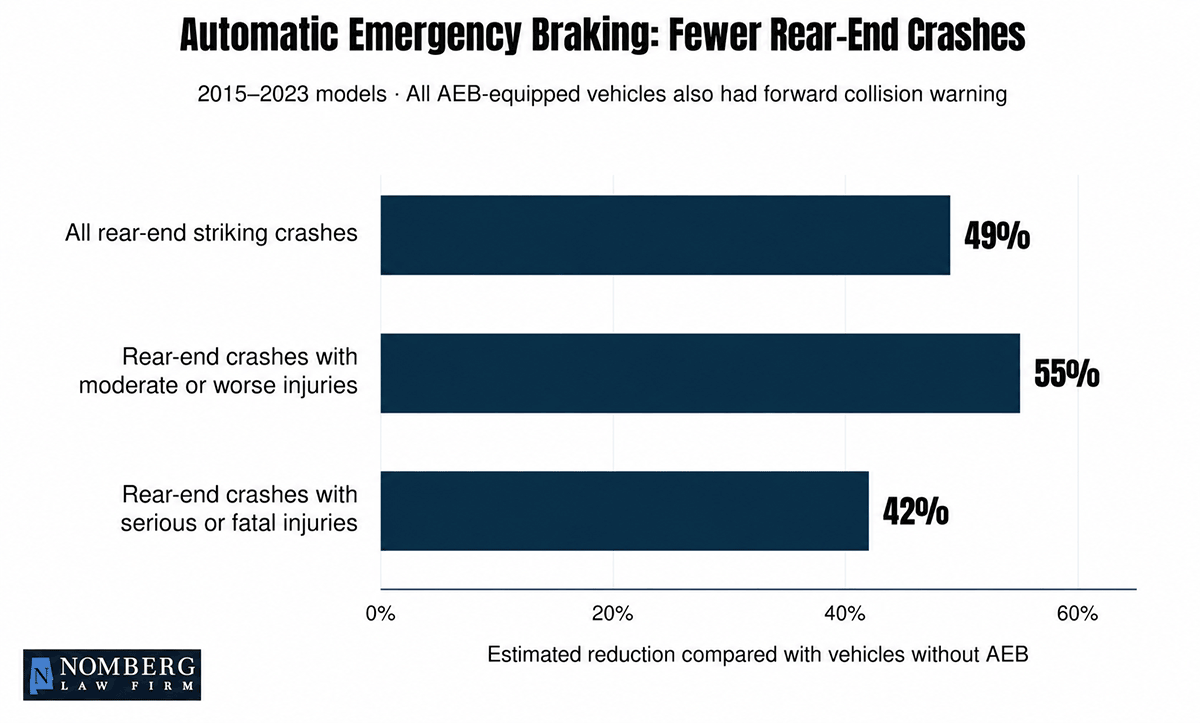
Automatic emergency braking (AEB) applies the brakes when it detects an impending collision. Unlike a warning alone, it can act if the driver does not respond in time.
A November 2025 PARTS study examined 2015–2023 vehicles using police-reported crashes from 2016–2023. Vehicles equipped with AEB also had forward collision warning. Compared with vehicles without AEB, they had approximately:
- 49% fewer crashes in which they struck another vehicle from behind
- 55% fewer such crashes involving moderate or worse injuries
- 42% fewer such crashes involving serious or fatal injuries
These are reductions in crashes, not percentages showing how many individual injuries or deaths were prevented.
Pedestrian braking also shows real-world benefits
Pedestrian automatic emergency braking detects people ahead and can brake to avoid hitting them.
The same PARTS study found an approximately 9% reduction in injury crashes involving one vehicle striking a pedestrian, cyclist, or another person outside a motor vehicle with its front. This finding covers that specific crash group, rather than every pedestrian crash.
Lane assistance can help prevent road-departure crashes
Lane-assistance features perform different tasks:
- Lane departure warning alerts the driver when the vehicle drifts out of its lane.
- Lane keeping assistance provides corrective steering or braking to help prevent an unintended departure.
- Lane centering assistance provides ongoing steering assistance to keep the vehicle centered.
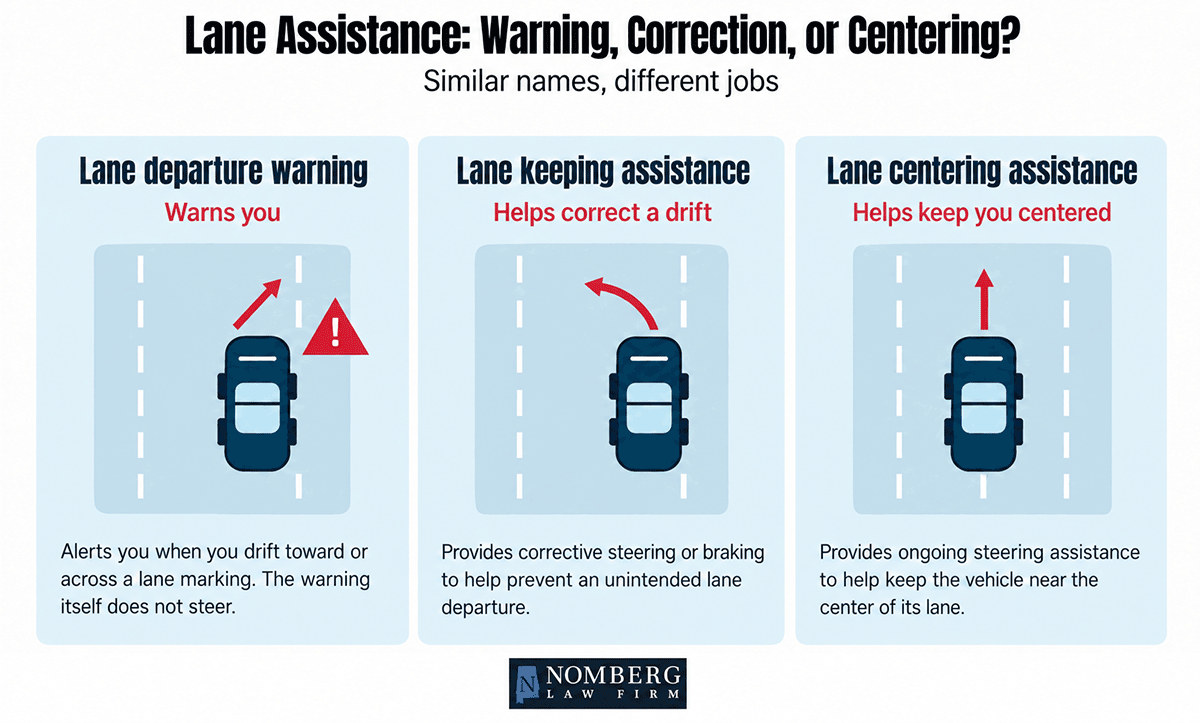
The PARTS study compared vehicles with these features to vehicles without any of the lane-assistance features studied. The results?
- Vehicles with lane departure warning and lane keeping assistance, but no lane centering assistance, had approximately 9% fewer single-vehicle road-departure crashes involving moderate or worse injuries.
- Vehicles with all 3 features had approximately 11% fewer such injury crashes and 12% fewer road-departure crashes involving serious or fatal injuries.
- For vehicles with lane departure warning alone, researchers could not confidently conclude that the feature reduced these crashes.
These findings looked at single-vehicle crashes involving departures from the road or crossings of the centerline or median. They did not cover every lane-change or sideswipe crash or establish that adding lane centering always provided greater protection than lane keeping alone.
Blind-spot warnings and feature combinations can reduce claims
A December 2025 HLDI study examined features offered together on 2015–2023 Mazda vehicles.
- Blind-spot detection and rear cross-traffic alert. These warn about vehicles beside the car or approaching while it reverses. Together, they were associated with 13% fewer bodily injury liability claims.
- More comprehensive feature packages. A package including pedestrian braking, lane assistance, and rear automatic braking was associated with 39% fewer property damage liability claims. Rear automatic braking applies the brakes when a collision is detected while reversing.
Because these features were studied in combinations, those results cannot be credited to one feature alone. The more comprehensive packages also included newer versions of existing systems.
What about Tesla’s Full Self-Driving system?
From its recent demonstration of a Roadster prototype taking flight to its Full Self-Driving (Supervised) system, Tesla is pushing the boundaries of vehicle technology. But do these advances make cars safer?
Tesla says production of the new Roadster is planned for 2028, so real-world safety findings will have to wait until production vehicles have spent enough time on public roads.
Tesla’s Full Self-Driving (Supervised) is already available. While it can help navigate intersections, make turns, change lanes, and follow a route, the driver must remain attentive and ready to take over. Despite its name, the system does not make the vehicle fully autonomous.
The crash-prevention studies discussed above examined particular features or feature combinations, rather than Tesla’s complete system. They therefore cannot tell us whether Full Self-Driving provides additional crash-prevention benefits. Our model-level death-rate comparisons cannot answer that question, either, because they do not identify whether the system was active at the time of a crash.
The research reviewed here shows that certain features can help prevent crashes. Whether Tesla’s ability to handle more of the driving provides additional protection is a separate question that these studies unfortunately do not answer.
What does the evidence show about the safety of driverless vehicles?
Driverless vehicles go beyond the assistance features discussed above. Within their operating limits, they can perform the driving task without a human supervising. But are self-driving cars safer than human-operated vehicles?
A July 2026 IIHS study compared Waymo’s driverless vehicles with human drivers in San Francisco, Phoenix, Los Angeles, and Austin using data from 2021–2024.
The comparison included approximately 50 million miles of driverless operation. The percentages include crashes that researchers determined would likely be reported to police, rather than every minor incident.
Across those locations combined, Waymo vehicles had:
- 68% fewer crash involvements per mile traveled
- 81% fewer injury-crash involvements per mile traveled
- A 91% lower rate of rear-ending another vehicle
- A 40% lower rate of being rear-ended by another vehicle
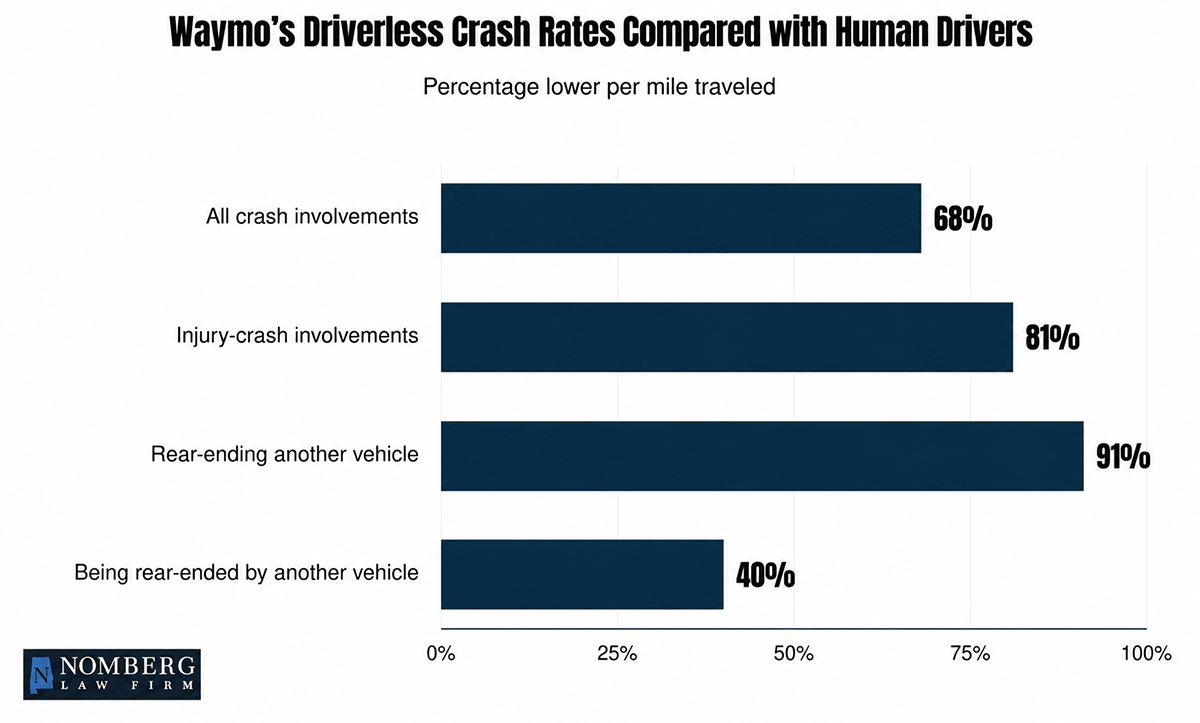
Interestingly, an earlier study published in the journal Accident Analysis & Prevention in 2021 found that automated vehicles were hit from behind almost 5 times more frequently per mile than human-driven vehicles. They were also more likely to be hit while stopped. Researchers suggested that their decisions about where and when to stop or remain stopped at intersections might contribute to that pattern.
Waymo’s lower rate of being rear-ended presents a different picture. Improvements in how automated vehicles handle traffic are one possible explanation, but the studies examined different vehicles, locations, periods, and crash-reporting methods, so we can’t conclude that better technology explains the difference.
Overall, the IIHS findings indicate that Waymo’s driverless vehicles were involved in substantially fewer crashes, including injury crashes, per mile than human drivers in the locations and conditions studied.
While this is encouraging evidence that driverless vehicles can deliver safety benefits, the results apply to Waymo in the conditions studied, not every driverless system or every driving situation. They also do not apply to consumer systems that require a driver to supervise.
The question is whether those safety benefits hold as driverless services expand to more roads and driving conditions—and whether similar benefits would extend to driverless vehicles people may eventually own and use for their daily travel.
So, how do you decide which vehicle is the safest?
The reality is that no single rating can tell you which vehicle is the safest choice for you or your family, but these findings give you a good starting point. As you research safety features, crash-test results, and death rates, think about how you’ll actually be using the vehicle every day.
If your commute involves frequent stops and traffic backups, look at automatic emergency braking that can respond when a vehicle ahead slows or stops. If you often drive through areas with people walking or biking, check pedestrian and cyclist detection performance. If family members often ride in the back seat, make sure to look at rear-seat crash protection.
And if you need a larger vehicle, consider its safety record for other drivers alongside the protection it provides your family. This is especially important in an at-fault state, where the driver who causes a crash may be responsible for the other people’s injuries and property damage.
Unfortunately, even when you do your research and take precautions, crashes still happen. If you get injured, you want a legal team in your corner with the experience to stand up to insurance companies so you can get the full compensation you deserve.
Nomberg Law Firm has spent more than 50 years representing injured Alabamians after serious crashes.
Our Birmingham car accident attorneys have seen firsthand how a catastrophic injury or wrongful death can change a family’s future. We work to ensure those consequences are fully accounted for in a claim, giving our clients personal attention while pursuing compensation for the losses they face now and in the years ahead.
If you or a loved one has been injured in an Alabama crash because of someone else’s negligence, contact our team for a free consultation to discuss how we can help.
References
Auto insurance fact sheets. (2022). IIHS-HLDI Crash Testing and Highway Safety. https://www.iihs.org/research-areas/auto-insurance/auto-insurance-fact-sheets
Driver death rates remain high for small cars, models with powerful engines. (2026, July 30). IIHS-HLDI Crash Testing and Highway Safety. https://www.iihs.org/news/detail/driver-death-rates-remain-high-for-small-cars-models-with-powerful-engines
Goodall, N. J. (2021). Comparison of automated vehicle struck-from-behind crash rates with national rates using naturalistic data. Accident Analysis & Prevention, 154, 106056. https://doi.org/10.1016/j.aap.2021.106056
Highway Loss Data Institute. (2025). Mazda collision avoidance features (2015–23) (pp. Vol. 42, No. 30). https://www.iihs.org/media/9b8e0542-7368-4fb9-a96b-9d01d60dc5c4/6Vyyvg/HLDI%20Research/Bulletins/hldi_bulletin_42-30.pdf
IIHS. (2012). About our tests. IIHS-HLDI Crash Testing and Highway Safety. https://www.iihs.org/ratings/about-our-tests
NHTSA. (2019, August 27). NHTSA. Nhtsa. https://www.nhtsa.gov/ratings
PARTS | partnership for Analytics Research in traffic safety. (2020, March 18). Nhtsa. https://www.nhtsa.gov/parts-partnership-for-analytics-research-in-traffic-safety
Real-world effectiveness of advanced driver assistance systems on injury crashes for model year 2015-2023 vehicles for public release (case number: 25-3048). (2025). https://www.mitre.org/sites/default/files/2025-11/PR-25-3048-PARTS-Effectiveness-of-Advanced-Driver-Assistance-Systems-Nov-2025.pdf
Teoh, E. R., Kidd, D. G., & Riexinger, L. E. (2026). Rise of the machines: Crash experiences of highly automated vehicles and human drivers. IIHS-HLDI Crash Testing and Highway Safety. https://www.iihs.org/research-areas/bibliography/ref/2374
Teoh, E. R., & Monfort, S. S. (2023, June). IIHS small overlap frontal crash test ratings and real-world driver death risk. IIHS-HLDI Crash Testing and Highway Safety. https://www.iihs.org/research-areas/bibliography/ref/2276